> For the complete documentation index, see [llms.txt](https://docs.trada.io/llms.txt). Markdown versions of documentation pages are available by appending `.md` to page URLs; this page is available as [Markdown](https://docs.trada.io/journal/period-reviews.md).
# Period reviews
Review performance by day, week, and month with stats, an equity curve, and reflection notes.
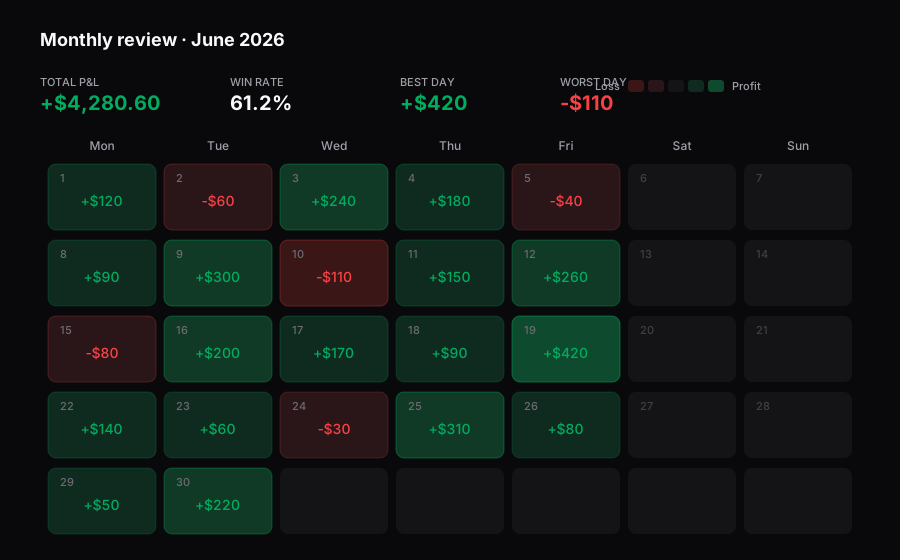
Period reviews aggregate your auto-synced trades into day, week, and month summaries so you can review how your process ran over each stretch. Every view shares the same layout — aggregated stats, an equity curve, and a reflection-notes editor — and differs only in how trades are grouped.
A monthly review — each trading day coloured by its P&L, with the month's totals above.
## Choose a period view
Period reviews live in three sibling pages under the journal:
| View | Grouping | Date label example |
| ----------- | ------------------------------------------ | ------------------------------------ |
| **Daily** | One calendar day, in your account timezone | 22 Oct 2025 |
| **Weekly** | One ISO week, Monday to Sunday | Week 42 - Oct 2025 (14 Oct - 20 Oct) |
| **Monthly** | One calendar month | October 2025 |
Each page opens in **Table** view by default. Use the view toggle in the action bar to switch to a **Card** carousel that steps through one period at a time, auto-focusing the current period. The toggle does not persist — the page resets to Table on reload, but your filters carry over.
Filter the list with the **Date Range** picker, the **Journaled** / **Not Journaled** status checkboxes, or the expandable search field. A period counts as **Journaled** once it has saved reflection notes — not based on individual trade notes.
{% hint style="info" %}
Periods with zero trades still appear in the list with a $0.00 P\&L and a 0% win rate. You can still open them and write notes.
{% endhint %}
## Read the period table
The table lists every period with a running balance carried forward from the prior period.
| Column | Content |
| -------------------- | ----------------------------------------------------------------- |
| **Date** | Period date or range |
| **Starting Balance** | Balance at period start (USD) |
| **Ending Balance** | Starting balance plus period P\&L |
| **P\&L** | Total P\&L for the period, green when positive, red when negative |
| **Performance** | Sparkline of cumulative P\&L through the period |
| **Trades** | Trade count, with a buys/sells breakdown on hover |
| **Win Rate** | Percentage, with a won/lost breakdown on hover |
| **Last 5 Trades** | Up to five win/loss badges, oldest to newest |
| **Actions** | Open the review, or share the period |
Starting balance for the first period is your configured account starting balance; every later period starts from the prior period's ending balance. Where a balance cannot be calculated, the cell shows an em dash.
## Open a period review
Click any table row or card to open the period review dialog. It gathers four parts for the selected day, week, or month: a statistics grid, an equity curve, a reflection-notes editor, and the full list of trades in that period.
## Read the aggregated stats
The statistics grid summarises the period at a glance. All figures are computed from your auto-synced trades — nothing is entered by hand.
| Card | Daily | Weekly / Monthly |
| -------------- | --------------------------------------------------------- | --------------------------------- |
| **Total P\&L** | Sum of trade P\&L, green when at or above zero, red below | Same |
| **Win Rate** | Wins divided by total trades, with a `W / L` subtext | Same |
| **Best** | **Best Trade** (highest single trade P\&L) | **Best Day** (highest daily P\&L) |
| **Worst** | **Worst Trade** (lowest single trade P\&L) | **Worst Day** (lowest daily P\&L) |
A period where wins exactly offset losses shows a $0.00 total in a neutral color rather than green or red. For the exact definitions behind win rate, expectancy, and profit factor, see the [formulas reference](/reference/formulas.md).
{% hint style="info" %}
These stats describe how a process ran over the period — discipline and consistency of execution. They are a record of what happened, not a forecast of future results.
{% endhint %}
## Read the equity curve
The equity curve plots cumulative P\&L across the period as an area chart. It renders green when the period's total P\&L is at or above zero and red when it is below. The x-axis adapts to the view:
* **Daily**: one point per trade (Trade 1, Trade 2, ...).
* **Weekly and Monthly**: one point per day (Day 1, Day 2, ...).
Hover any point to see the identifier and the cumulative P\&L at that step. The curve is hidden for periods with no trades.
## Write reflection notes
The **Review & Reflections** editor is always available, even for periods with no trades. Notes are stored per period and sync across your devices. They are separate from trade data: writing a note never changes a trade, and trades themselves cannot be added, edited, or deleted here.
{% stepper %}
{% step %}
### Open the editor
In a period review, click **Write Review** (or **Edit Review** if notes already exist). The section switches to edit mode.
{% endstep %}
{% step %}
### Write your reflection
Use the rich-text toolbar for bold, italic, headings, lists, and links. The placeholder prompts you on how the period went, your key learnings, and what to focus on next.
{% endstep %}
{% step %}
### Save
Click **Save Notes**. The section returns to view mode and the header badge switches from **No notes** to **Documented**. Closing the dialog without saving discards your changes.
{% endstep %}
{% endstepper %}
## Review the trades in a period
When the period has trades, the **All Trades** table lists each one — account, symbol, open time, side, amount, and P\&L — paginated below the equity curve. Every row is auto-synced from your connected account, so past periods are read-only for trades. Open a row's journal icon to add per-trade notes; see [Journaling a trade](/journal/journaling-a-trade.md).
## Share a period
Any period review can be shared as a **read-only certificate link**. The certificate is a live page rendered from your data — it shows the period's date, P\&L, win rate, trade count, and start and end balance. It is a link, not a file: there is no PDF, image, or download.
{% stepper %}
{% step %}
### Open the certificate
Click the **Share** button on a table row, card, or inside the period review.
{% endstep %}
{% step %}
### Create the link
Confirm the certificate. Trada generates a read-only link that renders the period live for anyone who opens it.
{% endstep %}
{% endstepper %}
{% hint style="warning" %}
A certificate link shows your real P\&L and balances in USD to anyone who has it. Share it deliberately, and see [Sharing](/sharing/sharing.md) for how to manage and revoke links.
{% endhint %}
## When a period has no trades
If no trades exist for the selected period, the review hides the stats grid, equity curve, and trades table and shows a banner noting there were no trades that day, week, or month. The reflection editor stays available so you can still document the period. If a journal page has no data at all, an empty state prompts you to connect an account — see [Connecting accounts](/connecting-accounts/connecting-accounts.md).
## Related
* [Journaling a trade](/journal/journaling-a-trade.md)
* [Sharing](/sharing/sharing.md)
* [Formulas reference](/reference/formulas.md)
* [Conventions](/reference/conventions.md)
---
# Agent Instructions
This documentation is published with GitBook. GitBook is the documentation platform designed so that both humans and AI agents can read, navigate, and reason over technical content effectively. Learn more at gitbook.com.
## Querying This Documentation
If you need additional information that is not directly available in this page, you can query the documentation dynamically by asking a question.
Perform an HTTP GET request on the current page URL with the `ask` query parameter, and the optional `goal` query parameter:
```
GET https://docs.trada.io/journal/period-reviews.md?ask=&goal=
```
`ask` is the immediate question: it should be specific, self-contained, and written in natural language.
`goal` is optional and describes the broader end goal you are ultimately trying to accomplish on behalf of the user. GitBook uses it to tailor the answer towards what is most useful for that goal.
The response will contain a direct answer to the question and relevant excerpts and sources from the documentation.
Use this mechanism when the answer is not explicitly present in the current page, you need clarification or additional context, or you want to retrieve related documentation sections.