> For the complete documentation index, see [llms.txt](https://docs.trada.io/llms.txt). Markdown versions of documentation pages are available by appending `.md` to page URLs; this page is available as [Markdown](https://docs.trada.io/reports-and-analytics/health-score.md).
# Trading Health Score
A 0 to 100 composite of six sub-scores that summarises how your process is running, not what it returns.
The Trading Health Score is a single number from 0 to 100 that rolls up six process metrics into one read on how disciplined and consistent your trading has been. It describes the shape of your process on your synced trades, not the money you have made or will make.
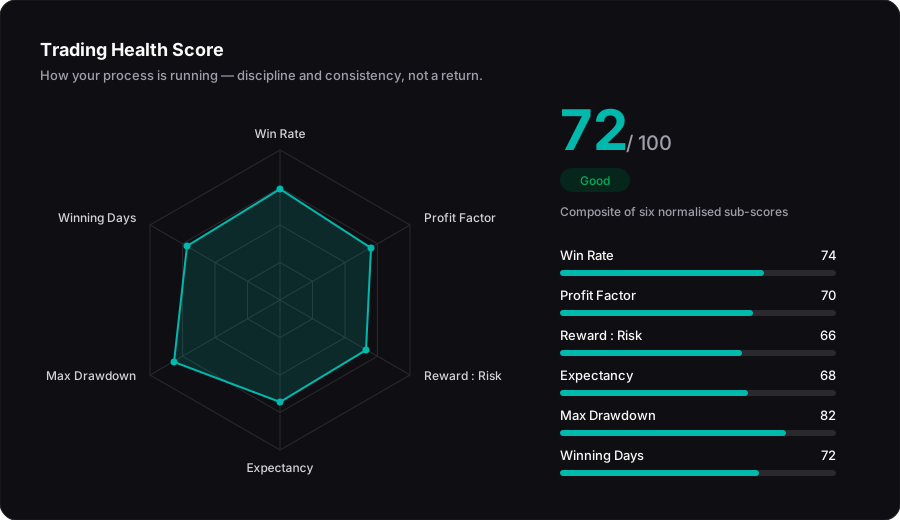
The Trading Health Score — six equally-weighted sub-scores rolled into one 0–100 read on process quality.
## Understand what the score measures
The score averages six sub-scores, each normalised to a 0–100 scale and weighted equally. Every sub-score looks at a different dimension of process quality: how you manage risk, how often you are right, how your wins compare to your losses, and how steady your results are day to day. Because all six are combined into one figure, the Trading Health Score is a summary of behaviour and consistency across your history, not a rating of any single trade.
All inputs come from trades auto-synced from your connected accounts. There is no manual trade entry, so the score always reflects your actual, imported activity. When you change the filters on the report, all six sub-scores recalculate against the filtered dataset and the radar chart re-draws.
{% hint style="info" %}
The Trading Health Score is a description of your past process, not a forecast. A high score reflects consistency and discipline in the trades you have already taken. It does not predict future results and is not a promise of profit. See the [risk disclaimer](/reference/legal.md).
{% endhint %}
## Read the six sub-scores
Each axis on the radar chart is one sub-score, already normalised to 0–100 so the six can be compared and averaged on the same scale.
| Sub-score | What it reflects | A higher sub-score means |
| ---------------------- | -------------------------------------------------------------------------- | ------------------------------------------------------------------- |
| **Max Drawdown** | The largest peak-to-trough dip in account equity over the period. | Smaller worst-case declines — tighter risk control. |
| **Profit Factor** | Gross profit divided by gross loss across the period. | Winning P\&L was larger relative to losing P\&L. |
| **Win Rate** | Share of closed trades that finished positive (breakeven trades excluded). | A larger proportion of trades closed in profit. |
| **Reward-to-Risk** | Average win size compared with average loss size. | Your average winner was larger relative to your average loser. |
| **Expectancy Quality** | Average P\&L per trade, measured against your average account balance. | Higher average result per trade, scaled to account size. |
| **Winning Days** | Share of trading days that closed net positive. | More of your trading days ended in the black — steadier day-to-day. |
Read together, these describe *how* you trade: Max Drawdown and Reward-to-Risk speak to risk discipline, Win Rate and Winning Days to consistency, and Profit Factor and Expectancy Quality to the quality of the edge already recorded in your synced trades. None of them is a projection.
{% hint style="info" %}
Sub-scores are capped at both ends. Very small drawdowns, a profit factor of 3.0 or more, and a reward-to-risk of 2.0 or more each reach the 100 ceiling; non-positive expectancy scores 0. This keeps one extreme metric from dominating the composite. The exact normalisation for each sub-score is documented in [Formulas](/reference/formulas.md).
{% endhint %}
## See how the composite is built
The overall score is the plain average of the six sub-scores, rounded to the nearest whole number:
```
Overall Health Score = (
MaxDD Score +
Profit Factor Score +
Win Rate Score +
Reward-to-Risk Score +
Expectancy Quality Score +
Winning Days Score
) / 6
```
All six carry equal weight, and the result always lands between 0 and 100. Because it is a simple average, a weak dimension pulls the composite down and a strong one lifts it — the number tells you the balance across all six, not which one is driving it. To see the breakdown, read the individual axes on the radar chart. Full per-metric formulas and worked examples live in [Formulas](/reference/formulas.md).
## Read the card on your report
{% stepper %}
{% step %}
### Open the report
Go to your report and select the **Overview** tab. The **Trading Health Score** card sits alongside the other overview cards.
{% endstep %}
{% step %}
### Check the overall score
The composite shows in the **Score** badge at the top-right of the card, for example **Score 78**. The hexagonal radar chart below plots all six sub-scores at once.
{% endstep %}
{% step %}
### Inspect a single dimension
Hover over any axis label or point on the polygon to open the tooltip. It shows the metric name, its raw value (for example a drawdown of **-15.2%**), that metric's **Score /100**, and a short description. On mobile, tap the chart area to reveal the nearest metric.
{% endstep %}
{% step %}
### Narrow the dataset
Adjust the report filters — date range, instrument, or session. All six sub-scores and the overall score recalculate against the filtered trades and the radar polygon re-draws. See [Filters](/reports-and-analytics/filters.md).
{% endstep %}
{% endstepper %}
## Handle empty and partial data
The score needs synced trades to compute. Behaviour in thin or extreme datasets:
* **No trades in the filtered range.** The card shows **No data available** in place of the radar chart and the score badge is hidden.
* **Very few trades.** Day-based metrics such as Winning Days may be undefined with only a single trade or day; an undefined sub-score contributes 0 to the average, so early scores can read low until more history syncs.
* **Only winners or only losers.** Extreme runs push several sub-scores to their 0 or 100 caps, as described in [Formulas](/reference/formulas.md). Treat these as artefacts of a small or one-sided sample, not as a verdict.
Because the composite is only ever as meaningful as the data behind it, read low scores on sparse history as "not enough signal yet" rather than a finding about your process.
## Share the score
The Trading Health Score appears on a shared report as a read-only link rendered live for whoever opens it — there is no file to download. Anyone with the link sees the same six sub-scores you do, recalculated from the same synced trades. See [Share a public report](/reports-and-analytics/share-public-report.md).
## Related
* [Formulas](/reference/formulas.md) — exact normalisation and worked examples for every sub-score
* [Overview tab](/reports-and-analytics/reports.md) — the other cards that sit beside the Trading Health Score
* [Filters](/reports-and-analytics/filters.md) — how narrowing the dataset recalculates the score
* [Risk disclaimer](/reference/legal.md) — what the score is and is not
---
# Agent Instructions
This documentation is published with GitBook. GitBook is the documentation platform designed so that both humans and AI agents can read, navigate, and reason over technical content effectively. Learn more at gitbook.com.
## Querying This Documentation
If you need additional information that is not directly available in this page, you can query the documentation dynamically by asking a question.
Perform an HTTP GET request on the current page URL with the `ask` query parameter, and the optional `goal` query parameter:
```
GET https://docs.trada.io/reports-and-analytics/health-score.md?ask=&goal=
```
`ask` is the immediate question: it should be specific, self-contained, and written in natural language.
`goal` is optional and describes the broader end goal you are ultimately trying to accomplish on behalf of the user. GitBook uses it to tailor the answer towards what is most useful for that goal.
The response will contain a direct answer to the question and relevant excerpts and sources from the documentation.
Use this mechanism when the answer is not explicitly present in the current page, you need clarification or additional context, or you want to retrieve related documentation sections.