> For the complete documentation index, see [llms.txt](https://docs.trada.io/llms.txt). Markdown versions of documentation pages are available by appending `.md` to page URLs; this page is available as [Markdown](https://docs.trada.io/reports-and-analytics/instruments-tab.md).
# Instruments tab
Performance broken down by symbol across your accounts.
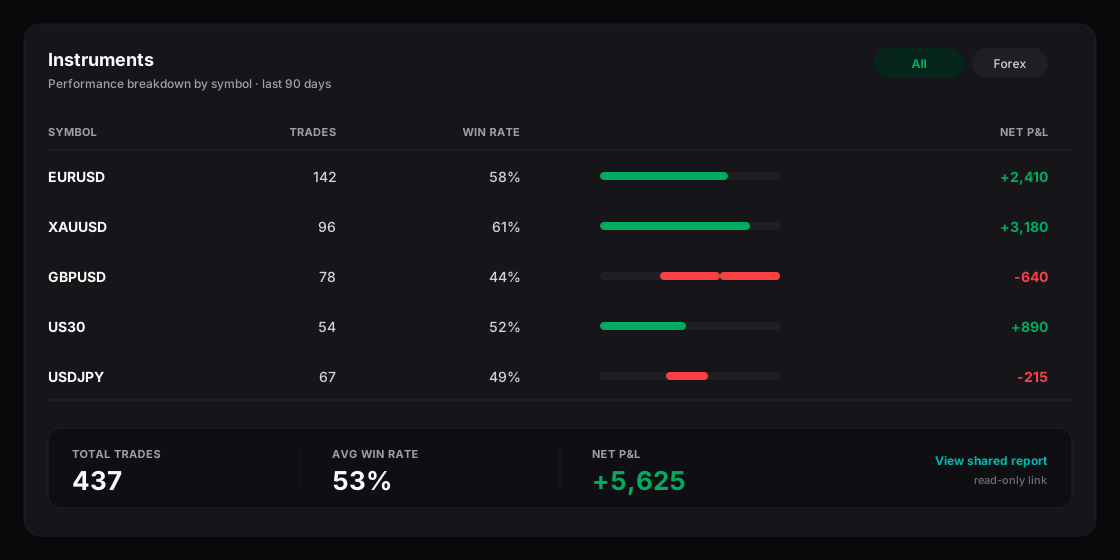
The **Instruments** tab breaks your synced trades down by symbol — currency pairs, futures contracts, and any other instrument on your connected accounts. It ranks your most-traded and best- and worst-performing symbols, then shows how each one behaves across months, weekdays, and hours.
All figures come from trades auto-synced from your connected accounts. There is no manual entry, so nothing here can drift out of sync with your broker or prop-firm records.
{% hint style="info" %}
The Instruments tab is part of the full **Report** and is available on paid plans. On the free plan the tab shows a short preview and then a blurred overlay with an upgrade prompt. See [Plans & billing](/plans-and-billing/plans-billing.md).
{% endhint %}
The Instruments tab — trades, win rate, and net P&L for each symbol.
## Read the Instruments overview
The **Instruments Overview** card pairs a **Top 5** table with a pie chart. Both are driven by a single **metric selector** dropdown, and both update together when you change it.
| Metric | What the table value shows | Sort order |
| ------------------- | ---------------------------------------------------------------- | -------------------- |
| **Total Volume** | Summed absolute quantity — lots for forex, contracts for futures | Highest volume first |
| **Most Profitable** | Summed P\&L from winning trades only, in USD | Largest gains first |
| **Most Losing** | Absolute summed P\&L from losing trades only, in USD | Largest losses first |
| **Total Trades** | Count of trades for the symbol | Most traded first |
| **Win Rate** | Share of trades with P\&L above zero, as a percentage | Highest rate first |
The table lists the top five symbols for the selected metric. Its third column normally shows total trade count; when the metric is **Total Trades**, it switches to a wins / losses breakdown (for example, `30W / 15L`). If fewer than five symbols match your filters, the table shows only those rows without padding.
The pie chart sizes every symbol proportionally to the same metric, ordered largest to smallest. Slices below 1% of the total are omitted to keep the chart readable.
{% hint style="info" %}
The metric selector resets to **Total Volume** each time you re-enter the tab. It is a view control, not a saved setting.
{% endhint %}
### Cross-highlight the table and chart
The table and pie chart are linked. On desktop, hovering a table row dims the other pie slices and outlines the matching one; hovering a slice shades the matching table row. On mobile, tap instead of hover — the highlight stays until you tap elsewhere. Each slice tooltip shows the symbol name and its value for the current metric.
## Compare performance across time periods
The **Cross Performance Analysis** table is a matrix: one row per symbol, one column per period. Two independent dropdowns control it.
{% stepper %}
{% step %}
### Choose a period type
Set **Period Type** to **Month**, **Day of Week**, or **Hour of Day**. Only periods with at least one trade appear as columns, and columns stay in calendar or clock order. Hours are grouped in your account timezone; see [Conventions](/reference/conventions.md).
{% endstep %}
{% step %}
### Choose a metric type
Set **Metric Type** to **P\&L**, **Profit Factor**, **Win Rate**, **Expectancy**, or **Relative DD**. The whole table recalculates instantly — no reload.
{% endstep %}
{% step %}
### Read the cells
Each cell holds one symbol's value for one period, color-coded by the thresholds below. The **Symbol** column stays pinned to the left as you scroll wide tables sideways.
{% endstep %}
{% endstepper %}
Both dropdowns reset to **Month** and **P\&L** when you re-enter the tab.
### Read the cell color coding
Colors describe how a process is running for that symbol and period — consistency and discipline, not a forecast of future results.
| Metric | Cell shows | Color thresholds |
| ----------------- | ----------------------------- | -------------------------------------------- |
| **P\&L** | Signed USD total | Green if ≥ 0, red if < 0 |
| **Profit Factor** | Ratio to two decimals, or `∞` | Green if ≥ 1.5, yellow if ≥ 1, red if < 1 |
| **Win Rate** | Percentage to one decimal | Green if ≥ 50%, red if < 50% |
| **Expectancy** | Average signed USD per trade | Green if ≥ 0, red if < 0 |
| **Relative DD** | Percentage to two decimals | Green if ≤ 5%, yellow if ≤ 10%, red if > 10% |
A cell with no trades for that symbol and period shows a gray em dash (`—`) and has no tooltip. A **Profit Factor** of `∞` means the symbol had no losing trades in that period. Full definitions live in [Formulas](/reference/formulas.md).
## Apply filters
Everything on this tab reflects the global filter banner — date range, account, symbol, strategy, and session. Changing a filter recalculates every table and chart at once, with no spinner. See [Filters](/reports-and-analytics/filters.md) for how each control narrows the dataset.
## Handle sparse or empty data
* **No trades after filtering.** The table shows a **No data available** message, the pie chart is hidden, and the metric selectors are disabled until the filter set matches trades again.
* **A single symbol.** The Top 5 table shows one row, the pie chart is a single full slice, and Cross Performance shows that one symbol.
* **Fewer than five symbols.** The table lists only the symbols present, without empty filler rows.
## Related
* [Health Score](/reports-and-analytics/health-score.md)
* [Performance tab](/reports-and-analytics/performance-tab.md)
* [Time tab](/reports-and-analytics/time-tab.md)
* [Formulas](/reference/formulas.md)
---
# Agent Instructions
This documentation is published with GitBook. GitBook is the documentation platform designed so that both humans and AI agents can read, navigate, and reason over technical content effectively. Learn more at gitbook.com.
## Querying This Documentation
If you need additional information that is not directly available in this page, you can query the documentation dynamically by asking a question.
Perform an HTTP GET request on the current page URL with the `ask` query parameter, and the optional `goal` query parameter:
```
GET https://docs.trada.io/reports-and-analytics/instruments-tab.md?ask=&goal=
```
`ask` is the immediate question: it should be specific, self-contained, and written in natural language.
`goal` is optional and describes the broader end goal you are ultimately trying to accomplish on behalf of the user. GitBook uses it to tailor the answer towards what is most useful for that goal.
The response will contain a direct answer to the question and relevant excerpts and sources from the documentation.
Use this mechanism when the answer is not explicitly present in the current page, you need clarification or additional context, or you want to retrieve related documentation sections.