> For the complete documentation index, see [llms.txt](https://docs.trada.io/llms.txt). Markdown versions of documentation pages are available by appending `.md` to page URLs; this page is available as [Markdown](https://docs.trada.io/reports-and-analytics/performance-tab.md).
# Performance tab
Profit factor, reward-to-risk, drawdown over time, and your best and worst trades.
The Performance tab is one of four tabs on the Report page. It reads your auto-synced trade history for the current filter selection and lays out four KPI cards, three charts, and a best/worst trades table — all describing how the account has behaved over the range you picked.
{% hint style="info" %}
The Performance tab is available on paid plans. On the free Starter plan the tab shows a short preview and then a blurred overlay with an upgrade prompt. See [Plans and billing](/plans-and-billing/plans-billing.md) and [Free / Starter](/plans-and-billing/free-starter.md).
{% endhint %}
Every figure here is calculated from trades that Trada pulls from your connected accounts. There is no manual trade entry, editing, or deletion — the tab reflects exactly what your broker or prop-firm account reported. See [Connecting accounts](/connecting-accounts/connecting-accounts.md).
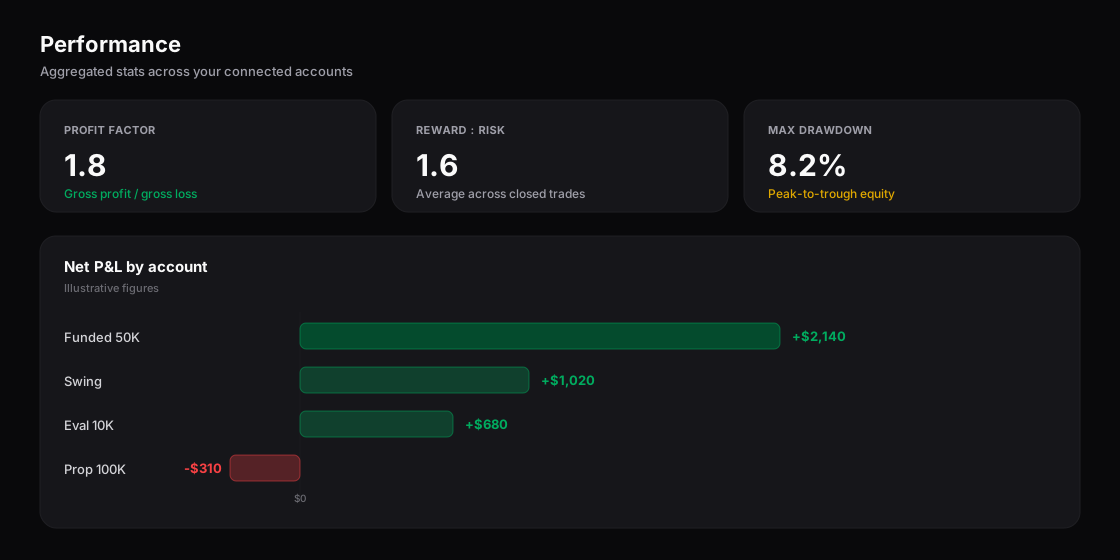
The Performance tab — profit factor, reward-to-risk, drawdown, and net P&L per account.
## Read the KPI cards
Four cards sit at the top of the tab. Each shows a title, a main value, and a sparkline tracing that metric across your trade sequence. Hover a sparkline (tap on mobile) for a tooltip reading `Trade #X: [value]`.
| Card | What it describes | Format |
| ---------------------- | ---------------------------------------------------------- | -------------------------------------- |
| **Profit Factor** | Gross profit divided by gross loss over the filtered range | Ratio, 2 decimals (e.g. `2.45`) |
| **Avg Risk to Reward** | Average win divided by the absolute average loss | Ratio, 2 decimals (e.g. `1.85`) |
| **Relative DD** | Largest drawdown reached, as a percentage of peak equity | Percentage, 2 decimals (e.g. `12.35%`) |
| **Recovery Factor** | Net P\&L divided by the largest dollar drawdown | Ratio with `×` (e.g. `3.45×`) |
These are historical summaries of a closed sample, not forecasts. They tell you how the filtered trades already played out; they do not project future results. Full definitions and edge-case handling live in [Formulas](/reference/formulas.md).
On mobile the four-card row collapses to a 2×2 grid, in the same order.
## Read the charts
Three charts sit below the cards. All support hover tooltips on desktop and tap-to-show / tap-outside-to-dismiss on mobile. They animate to new values when you change a filter; there is no zoom, pan, or drill-down.
### Win/Loss Size Analysis
A scatter plot of individual trade P\&L. The x-axis is the trade sequence number, the y-axis is P\&L in USD, and each point is one trade — green for a win, red for a loss. A dashed line at zero is labelled **Break Even**. Hovering a point shows its trade number, P\&L, and win/loss label.
### Drawdown Over Time
A bar chart of end-of-day drawdown across the range. The x-axis is date, the y-axis is drawdown percentage, and each red bar's height is that day's drawdown. Hovering a bar shows the date, the drawdown in USD, and the drawdown percentage. When several trades fall on one day, the bar reflects the end-of-day figure.
### Win vs Loss Overview
A semi-donut split into three segments — **Avg Loss** (red), **Avg Trade** (gray), and **Avg Win** (green) — sized by the absolute magnitude of each. The legend below lists the values. Hovering a segment expands it: biggest win/loss, average win/loss, and totals for that side.
## Compare best and worst trades
The Top 5 Trades table lists your five highest or five lowest trades by P\&L for the current filters. Columns are Symbol, Side, Date, P\&L, and Actions. The **Side** badge is green for buy and red for sell; the P\&L value is green when positive, red when negative.
{% stepper %}
{% step %}
### Switch the view
Use the toggle in the card header to choose **Best** or **Worst**. The table re-sorts instantly — descending by P\&L for **Best**, ascending for **Worst**. The selection resets to **Best** when you leave and re-enter the tab.
{% endstep %}
{% step %}
### Open a trade
In the **Actions** column, the journal icon shows whether the trade has a journal note — a checkmark if it does, an X if it doesn't. Click it to open the Trade Detail modal, pre-filled with that trade's data. Closing the modal returns focus to the table.
{% endstep %}
{% endstepper %}
The table is fixed at five rows and is not expandable. If fewer than five trades match, it shows only what exists. When exactly five match, the **Best** and **Worst** views list the same trades in inverted order. Tied P\&L values are ordered by timestamp, earliest first.
## Understand how filters apply
Every card and chart on this tab recalculates from the same filtered dataset. Changing Date Range, Account, Symbol, Strategy, or Session updates all of them at once, with no reload. Progression sparklines begin at the first trade inside the selected range, and the "open" balance is the balance at the start of that range rather than at account creation. See [Filters](/reports-and-analytics/filters.md).
## Handle empty and small samples
The tab stays readable when a filter leaves little or no data:
| Situation | What you see |
| --------------------------- | --------------------------------------------------------------------------------------------- |
| No trades match the filters | Charts hide; KPI cards show `0.00` or `∞`; the table reads "No trades match your filters" |
| A single trade | Sparklines show `N/A`; main values still display; the scatter shows one point |
| All wins, no losses | Profit Factor and Avg Risk to Reward show `∞`; the donut hides its red segment |
| All losses, no wins | Profit Factor shows `0.00`; Avg Risk to Reward shows `N/A`; the donut hides its green segment |
| A value can't be computed | An unavailable figure shows `—` (em dash); an undefined ratio shows `∞` |
{% hint style="info" %}
Performance figures are a snapshot, not a live feed. If new trades sync while the tab is open, refresh the page to fold them in. All times follow UTC or your account timezone per [Conventions](/reference/conventions.md).
{% endhint %}
## Related
* [Health score](/reports-and-analytics/health-score.md)
* [Formulas](/reference/formulas.md)
* [Filters](/reports-and-analytics/filters.md)
* [Share a public report](/reports-and-analytics/share-public-report.md)
---
# Agent Instructions
This documentation is published with GitBook. GitBook is the documentation platform designed so that both humans and AI agents can read, navigate, and reason over technical content effectively. Learn more at gitbook.com.
## Querying This Documentation
If you need additional information that is not directly available in this page, you can query the documentation dynamically by asking a question.
Perform an HTTP GET request on the current page URL with the `ask` query parameter, and the optional `goal` query parameter:
```
GET https://docs.trada.io/reports-and-analytics/performance-tab.md?ask=&goal=
```
`ask` is the immediate question: it should be specific, self-contained, and written in natural language.
`goal` is optional and describes the broader end goal you are ultimately trying to accomplish on behalf of the user. GitBook uses it to tailor the answer towards what is most useful for that goal.
The response will contain a direct answer to the question and relevant excerpts and sources from the documentation.
Use this mechanism when the answer is not explicitly present in the current page, you need clarification or additional context, or you want to retrieve related documentation sections.