> For the complete documentation index, see [llms.txt](https://docs.trada.io/llms.txt). Markdown versions of documentation pages are available by appending `.md` to page URLs; this page is available as [Markdown](https://docs.trada.io/reports-and-analytics/reports.md).
# Reports overview
Cross-account analytics in four tabs, with real-time equity and a Trading Health Score.
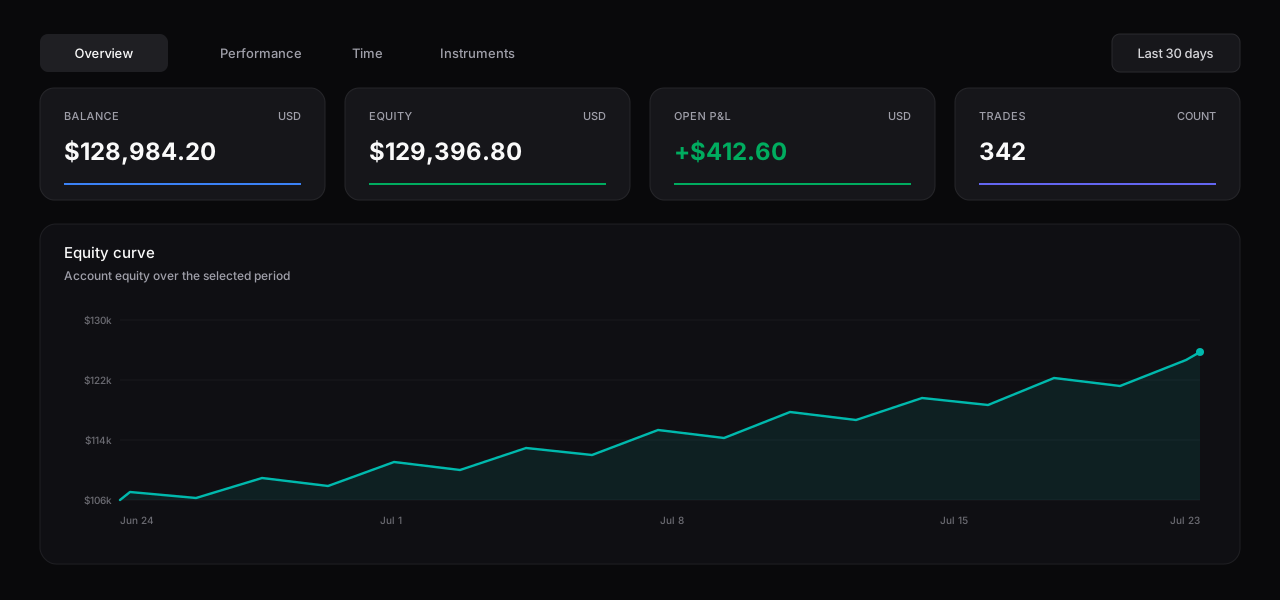
Reports aggregate the trades auto-synced from every connected account into one analytics view. The data is split across four tabs — Overview, Performance, Time, and Instruments — with equity and open P\&L streaming live while the rest of the numbers are computed on page load.
The Reports overview — balance, equity, open P&L, and trade count above your equity curve.
## Open a report
{% stepper %}
{% step %}
### Go to Reports
Select **Reports** in the sidebar, or use the **View Report** action on the Dashboard.
{% endstep %}
{% step %}
### Land on the Overview tab
The report opens on **Overview** by default. Switch tabs with **Overview**, **Performance**, **Time**, and **Instruments** at the top of the page.
{% endstep %}
{% step %}
### Scope the data
Apply the filter banner to narrow the dataset by date range, account, symbol, strategy, or session. See [Filters](/reports-and-analytics/filters.md).
{% endstep %}
{% endstepper %}
## Aggregate across accounts
Every metric is calculated over the trades pulled from your connected accounts. By default the report includes all accounts; the account filter lets you aggregate a subset. All trades are auto-synced from connected accounts — there is no manual entry, editing, or deletion, so the numbers reflect exactly what your accounts report.
Values are shown in USD and use the term P\&L throughout. Only USD accounts are supported in this version. See [Conventions](/reference/conventions.md) and [Formulas](/reference/formulas.md) for how each figure is defined.
{% hint style="info" %}
If you have no connected account, or an account with no trades yet, the report shows placeholder content with a prompt to connect or start trading. See [Connecting accounts](/connecting-accounts/connecting-accounts.md).
{% endhint %}
## Read the Overview KPI cards
The Overview tab opens with a row of summary cards:
| Card | What it shows | Updates |
| ------------ | ----------------------------------------------- | ------------ |
| **Balance** | Closed-position balance reported by the account | On page load |
| **Equity** | Balance plus open P\&L | Real time |
| **Open PnL** | Unrealized P\&L of currently open positions | Real time |
| **Trades** | Count of trades in the filtered set | On page load |
| **Account** | Number of accounts in scope | On page load |
Equity and open P\&L stream over a WebSocket connection, so they move as your open positions move. Every other metric on the page — balance, trade counts, charts, and breakdowns — is computed when the page loads and stays fixed until you refresh.
{% hint style="info" %}
If the live connection drops, the equity and open P\&L cards hold their last received value. Refresh the page to resync.
{% endhint %}
Below the KPI cards, the Overview tab also carries the Trading Health Score, the four performance metric cards (Total P\&L, Win Rate, Expectancy, Profit Factor), the main chart, distribution breakdowns by side, strategy, and session, and a trading calendar.
## Understand the Trading Health Score
The **Trading Health Score** summarizes how your trading process is running — discipline and consistency across several dimensions — rendered as a radar chart with a combined score. It describes process, not outcomes: it is not a prediction of results and makes no claim about future performance. See [Trading Health Score](/reports-and-analytics/health-score.md).
## Explore the analytics tabs
| Tab | What it covers | Availability |
| --------------- | --------------------------------------------------------------------------------- | ------------ |
| **Overview** | KPI cards, Trading Health Score, main chart, distribution breakdowns, calendar | All plans |
| **Performance** | Performance metric cards, breakdown table, dispersion and cross-performance views | Paid plans |
| **Time** | Hourly, weekday, and monthly breakdowns | Paid plans |
| **Instruments** | Per-instrument breakdowns, rankings, and cross-performance | Paid plans |
Read more on each: [Performance tab](/reports-and-analytics/performance-tab.md), [Time tab](/reports-and-analytics/time-tab.md), [Instruments tab](/reports-and-analytics/instruments-tab.md).
{% hint style="info" %}
The Overview tab is available on every plan, including the free tier. The Performance, Time, and Instruments tabs require a paid plan; on the free tier they show a short preview and then prompt to upgrade. See [Plans and billing](/plans-and-billing/plans-billing.md) and [Free and Starter](/plans-and-billing/free-starter.md).
{% endhint %}
## Filter and share
The filter banner applies globally across all four tabs. Filters are session-only and sync to the URL for browser back and forward, but are not saved between visits. Date ranges use your local timezone. Full detail in [Filters](/reports-and-analytics/filters.md).
Use **Share Performance** in the filter banner to publish a read-only public report. The link renders live in the browser from a saved snapshot of the filtered data — there is no file to download. See [Share a public report](/reports-and-analytics/share-public-report.md).
{% hint style="warning" %}
A public report link exposes the snapshot to anyone who has the URL. Only share it with people you intend to give access to.
{% endhint %}
## Related
* [Trading Health Score](/reports-and-analytics/health-score.md)
* [Filters](/reports-and-analytics/filters.md)
* [Share a public report](/reports-and-analytics/share-public-report.md)
* [Conventions](/reference/conventions.md)
---
# Agent Instructions
This documentation is published with GitBook. GitBook is the documentation platform designed so that both humans and AI agents can read, navigate, and reason over technical content effectively. Learn more at gitbook.com.
## Querying This Documentation
If you need additional information that is not directly available in this page, you can query the documentation dynamically by asking a question.
Perform an HTTP GET request on the current page URL with the `ask` query parameter, and the optional `goal` query parameter:
```
GET https://docs.trada.io/reports-and-analytics/reports.md?ask=&goal=
```
`ask` is the immediate question: it should be specific, self-contained, and written in natural language.
`goal` is optional and describes the broader end goal you are ultimately trying to accomplish on behalf of the user. GitBook uses it to tailor the answer towards what is most useful for that goal.
The response will contain a direct answer to the question and relevant excerpts and sources from the documentation.
Use this mechanism when the answer is not explicitly present in the current page, you need clarification or additional context, or you want to retrieve related documentation sections.